
Measuring electricity impacts on micro and small businesses in Sierra Leone
nLine deployed sensors within 48 micro and small-sized businesses in Freetown, Sierra Leone to understand the nature and scale of power quality and reliability (PQR) issues and their impacts on business operations and decision making. Data from the sensors will generate one year of continuous, ground-truth insights and will characterize the nature of power availability and quality along the length of the utility distribution grid network across 12 communities in Freetown.
Motivation
Poor power quality and reliability (PQR) in sub-Saharan Africa is estimated to cost the region 1-5% of GDP. In low-income countries (LICs) like Sierra Leone, PQR is closely tied with economic, environmental, and social inequalities: 80% of those who chronically experience poor PQR operate the micro, small and medium sized- enterprises (MSMEs) that deliver more than 50% of job creation and drive economic growth.
Although PQR is critical for MSME productivity, the mechanisms linking poor PQR to MSME productivity in LICs remain poorly understood mostly because of limited to non-existent data required to capture the nature and spatial and temporal variations of PQR.
Studies linking PQR with MSME outcomes tend to rely on macro-level recall-survey (e.g., the World Bank Enterprise Surveys) that ask binary questions around “hours of access” and “cost of fuel use on profitability”, and use electric utility collated data — which are known to be unreliable. These studies often rely on proxies to measure PQR impacts on firms, such as changes in electricity generation. The use of surveys alone and proxies for understanding the impact of PQR issues on MSMEs are problematic for three reasons:
- Many PQR impacts are not directly perceived by customers and therefore are impossible to capture in recall-based surveys
- Energy generation is a crude proxy for PQR because it does not capture the quality of energy delivered at customer points-of-connection
- Both surveys and data proxies fail to capture temporal granularity and variation which can be a powerful tool for addressing endogeneity concerns
Project Description
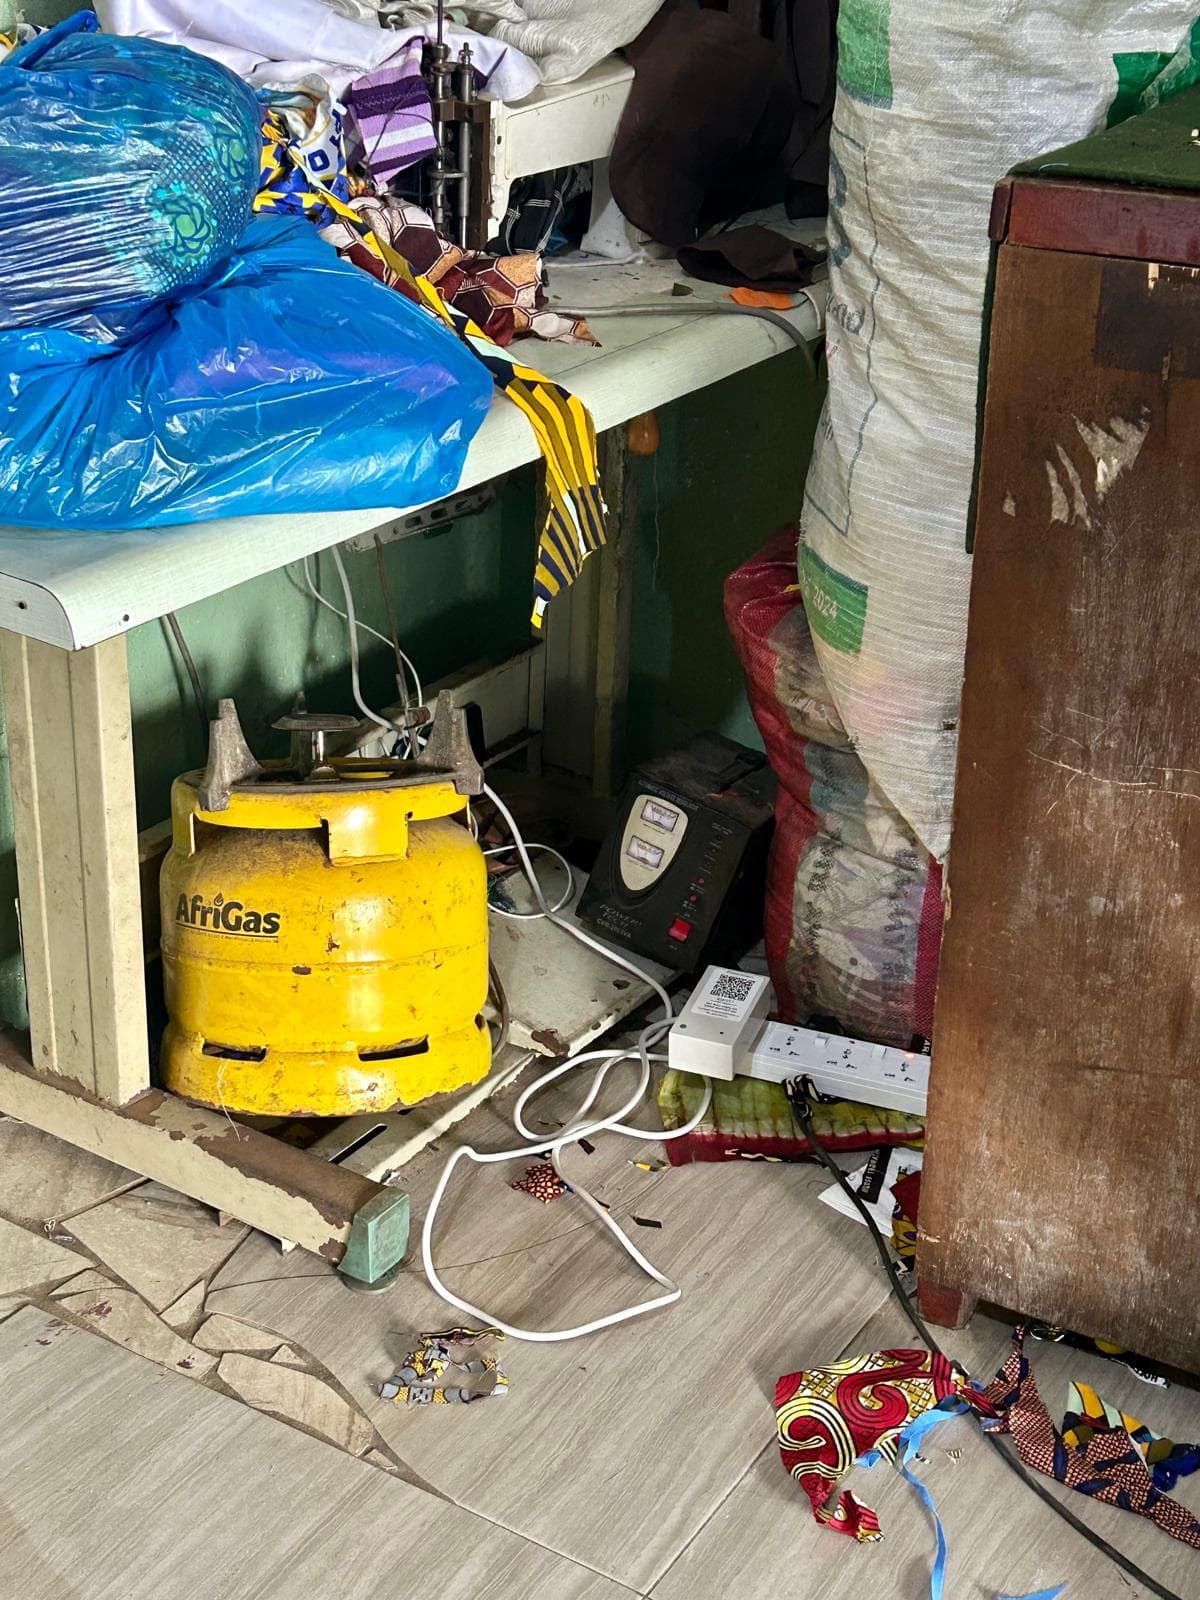
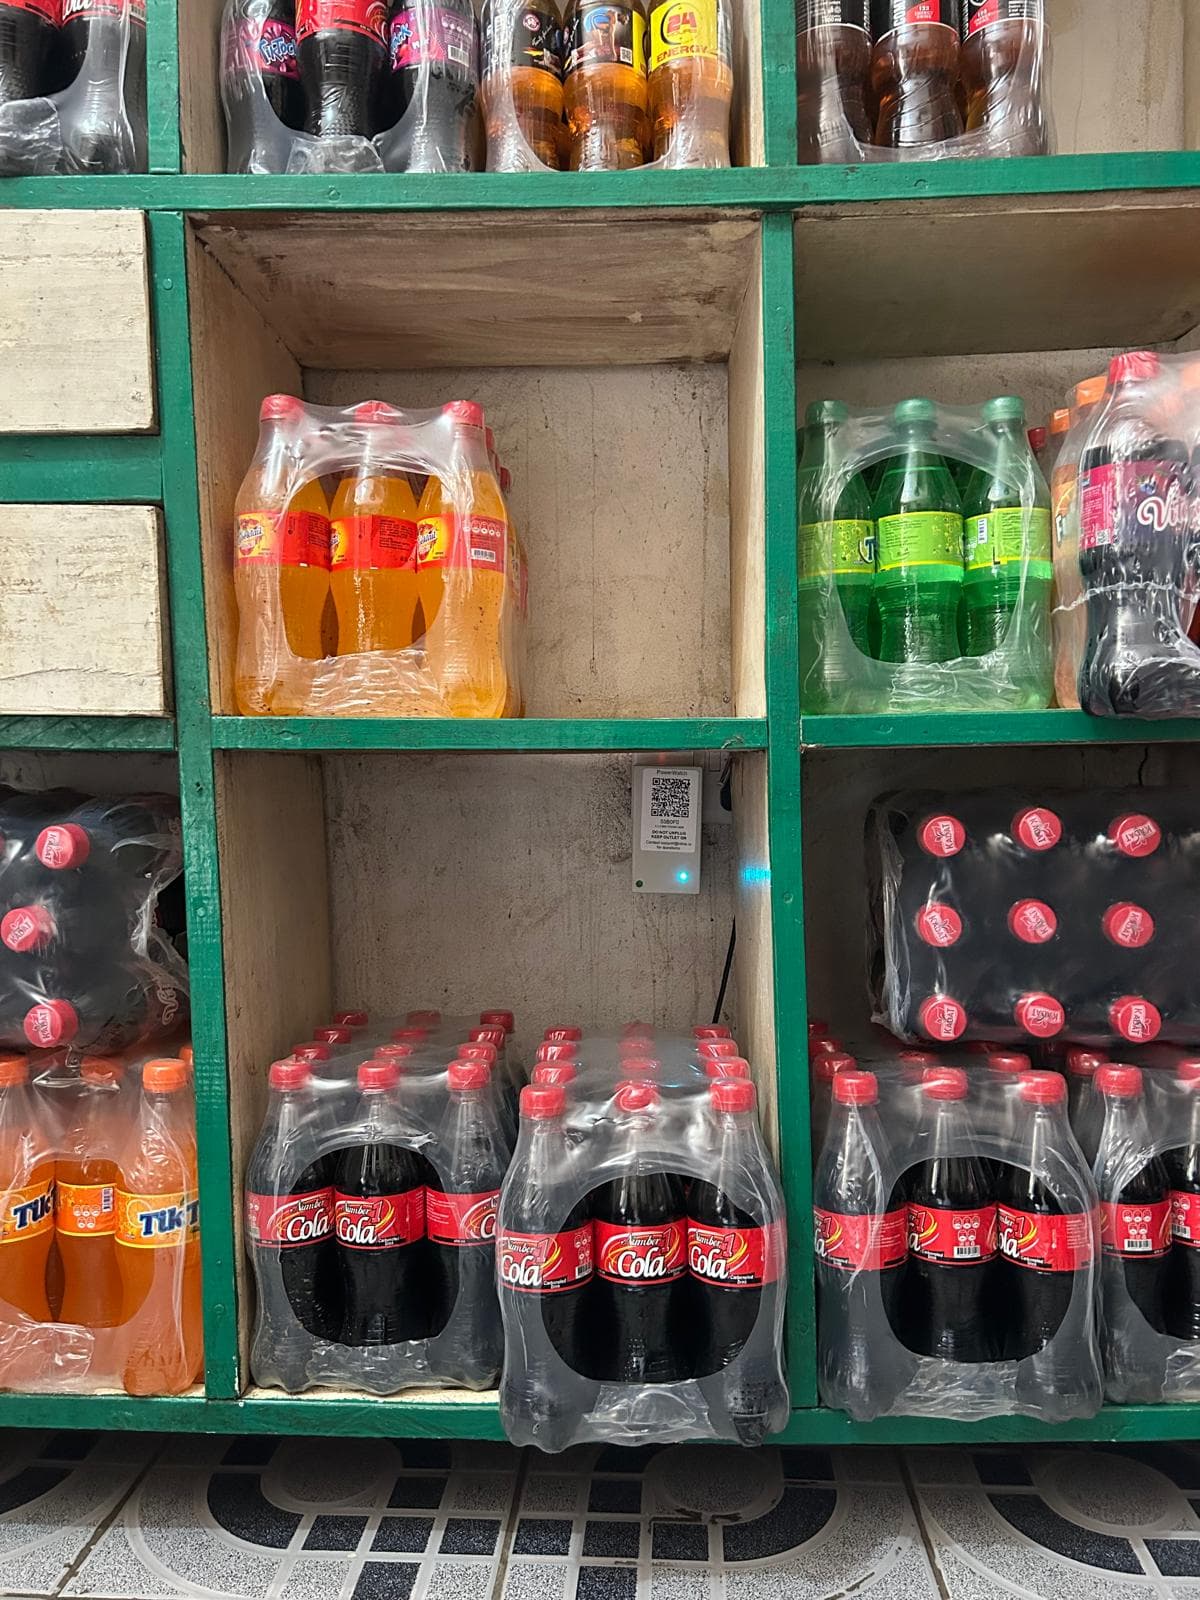
In October 2024, nLine sensors were deployed within 48 micro and small-sized businesses in 12 communities across Western Urban and Western Rural districts of Freetown. These grid-connected businesses receive power from the Electricity Distribution and Supply Authority (EDSA) alone and do not have backup energy sources (e.g. solar or generator). In order to obtain high coverage of voltage and outage measurements along the length of EDSA’s distribution network, we selected 12 communities that are spread throughout Freetown.
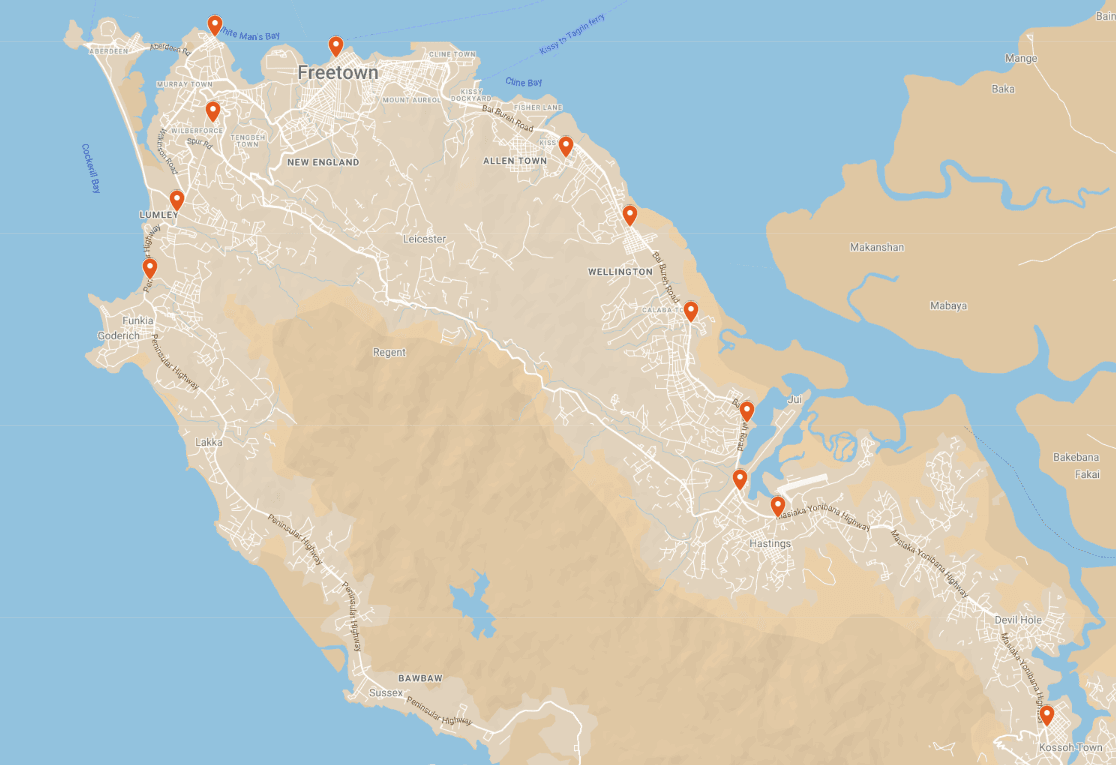
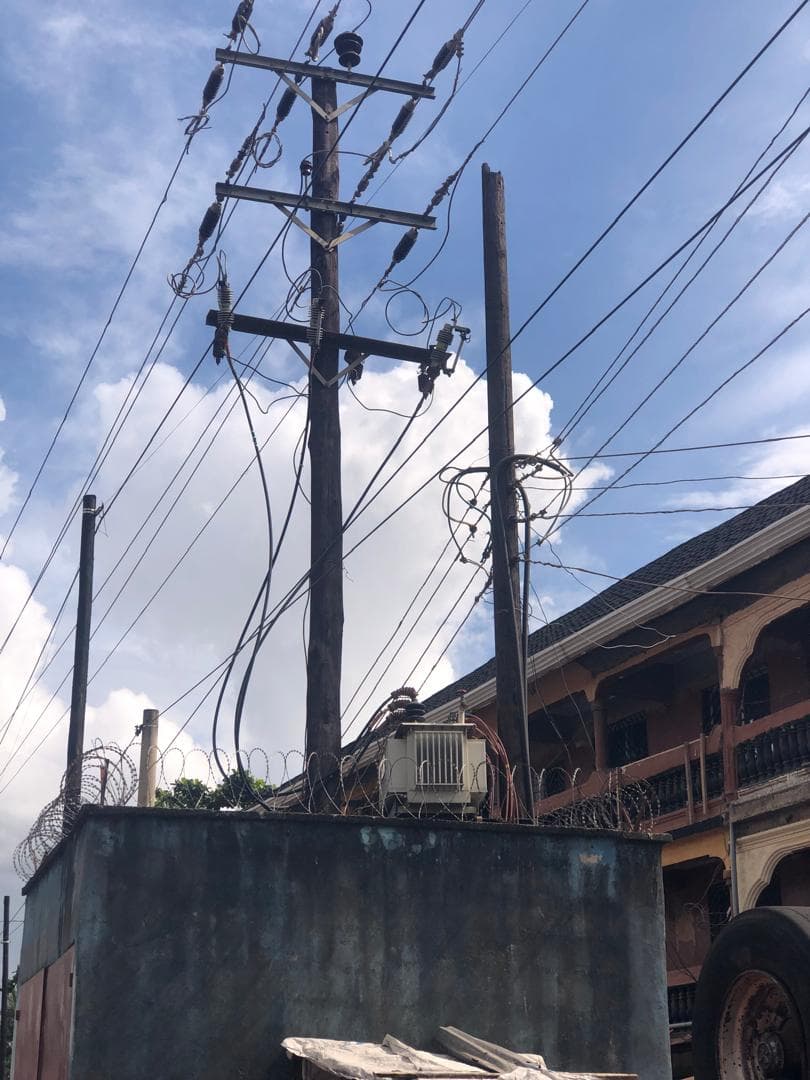
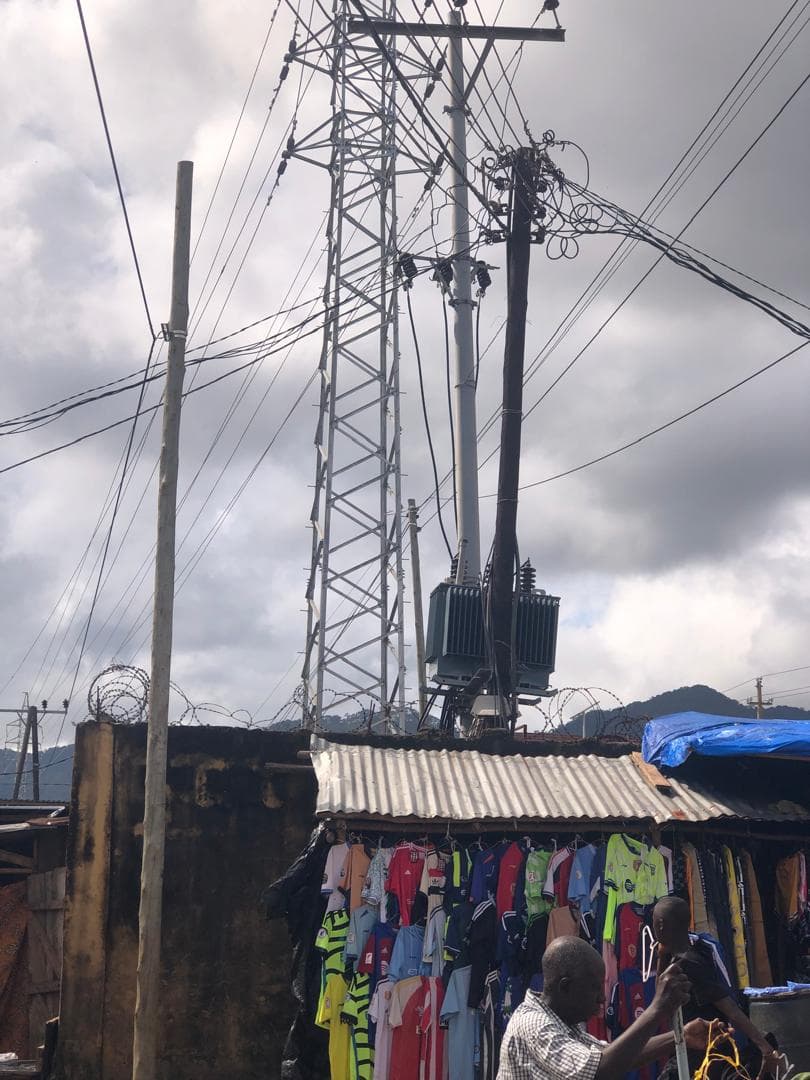
In each of the 12 communities, we located a distribution transformer that served at least 10+ businesses. Sensors were then installed with four randomly selected businesses that are connected to the transformer, which allows nLine to:
- Generate business-level and transformer-level measurements of PQR.
- Understand how electricity is impacting individual businesses.
- Assess whether there are different areas within EDSA’s grid network that provide better or worse power for commercial business areas.
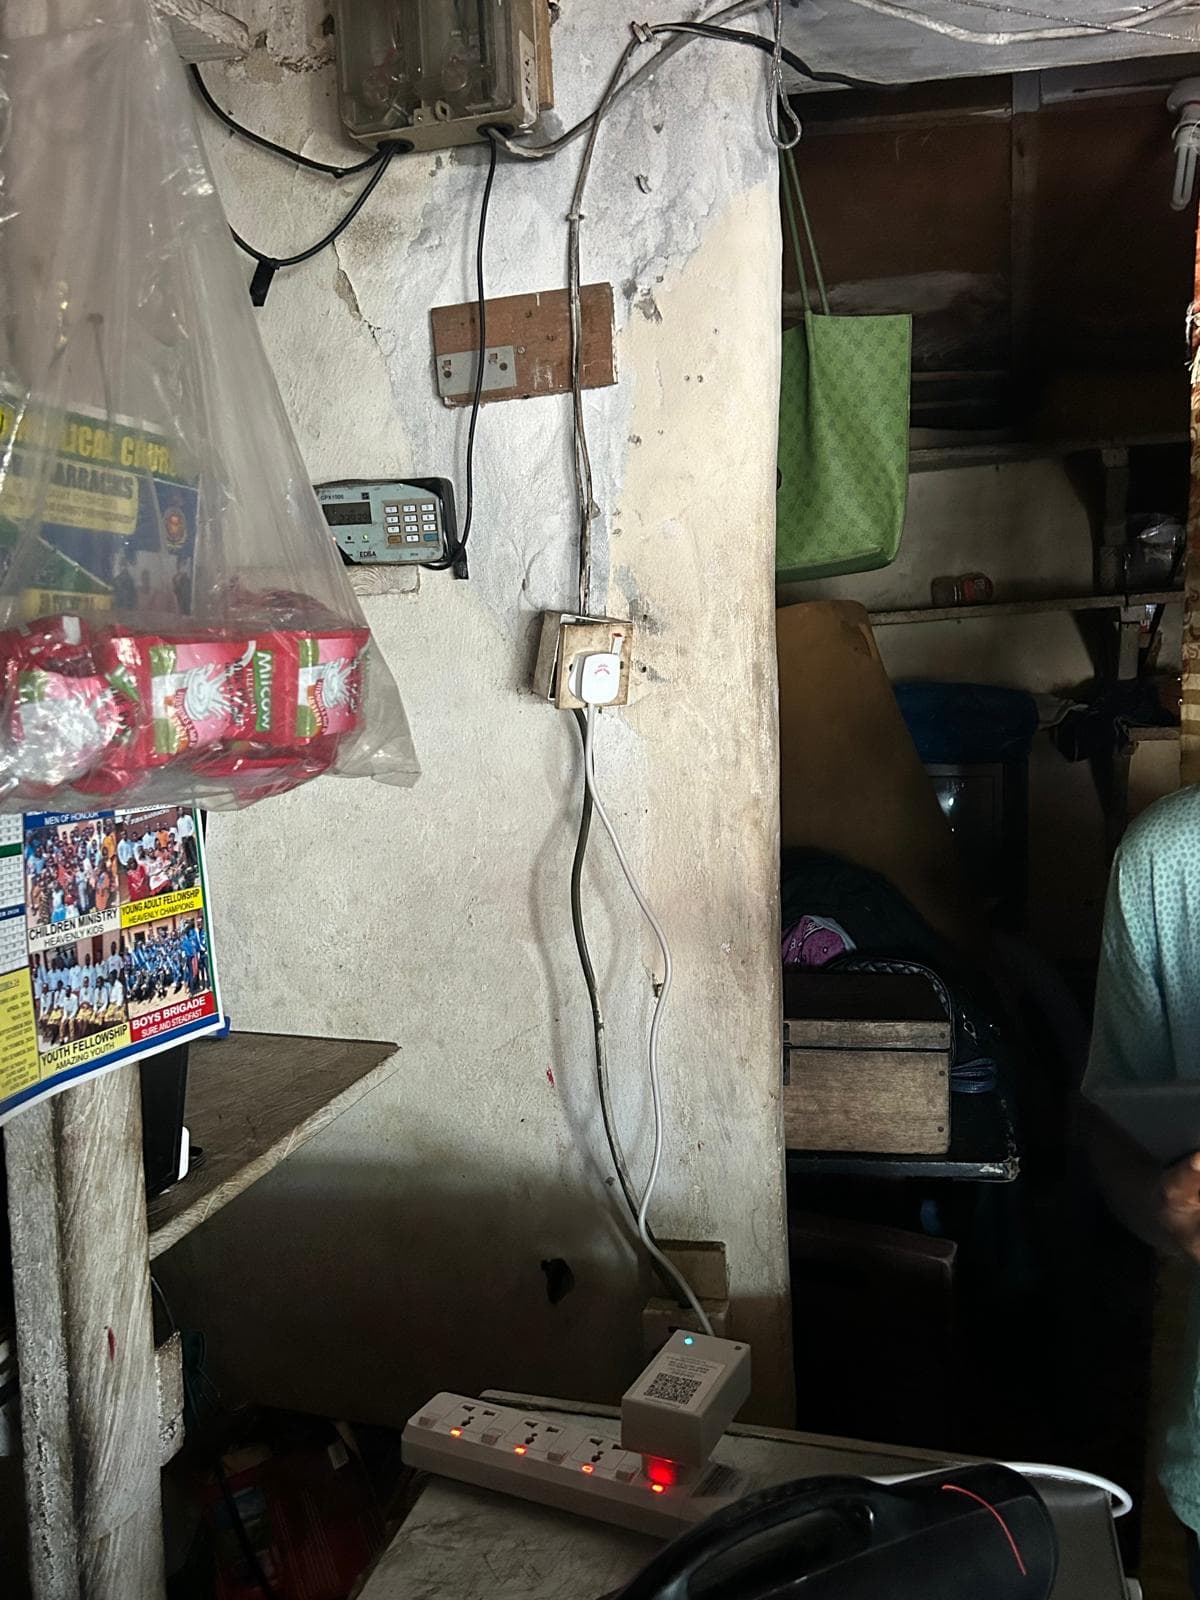
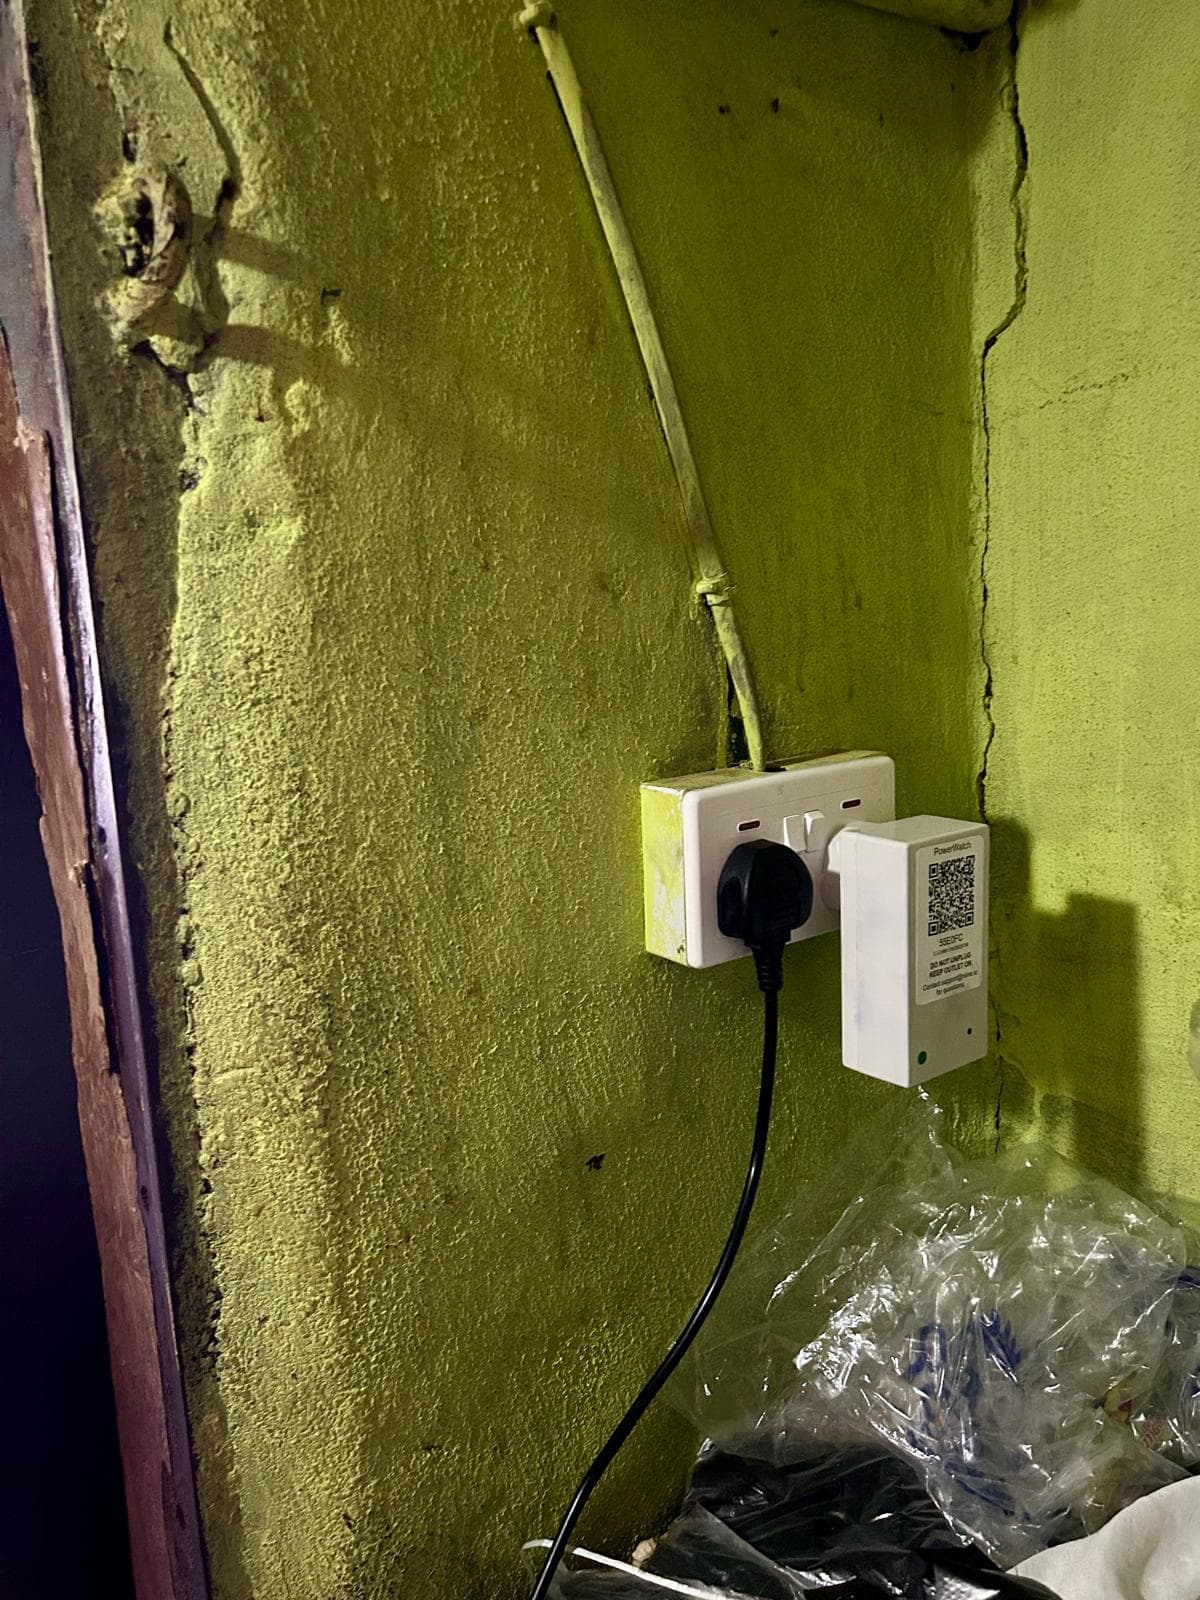
nLine sensors continuously measure outlet-level voltage magnitude, AC frequency, and power state at two minute intervals at each business. Additionally, nLine administered quantitative and qualitative survey questions to businesses which will provide descriptive data on their electricity usage and the impacts of PQR on their productivity and operations.
Results from this project will inform the following research questions:
- What is the nature, scale and variation of PQR among MSMEs in urban and peri-urban Freetown?
- What is the nature, scale and variation of PQR in different areas of the EDSA distribution grid network?
- What role does PQR play in MSME operating costs and business resilience strategies?

Key Insights
Survey Findings
In the survey with 48 MSMEs, shop owners and managers were asked to report on the number of outages experienced at their businesses within the last week and the average total duration of each of these power outages. By multiplying this duration with the reported number of power outages, we estimated the average total number of hours without power in a week for a MSME.


Sensor Data Findings
Sensor measurements of power quality and reliability at the 48 MSMEs revealed the following key insights:
There are spatial inequities in power reliability across Freetown. Data reveals significant spatial disparities in the nature and scale of PQR across Freetown’s grid, with a distinct east–west divide. MSMEs located in communities in the east (e.g. Calaba Town, Jui, Kissy, Waterloo, Wellington, and Hastings) consistently experienced substantially longer duration of outages than those in communities in the west (e.g. Central Business District, Goderich, Lumley, Murray Town, and Wilberforce). This spatial pattern suggests that the observed power reliability challenges are rooted in both structural conditions of HV-MV transmission infrastructure and in LV inefficiencies.


There are spatial inequities in voltage quality across Freetown, which also impacts MSME operations and finances. Voltage performance issues were varied across monitored communities, with some communities facing repeated voltage surges and others facing chronic undervoltage. As observed with power outages, MSMEs located in the east (e.g. Hastings, Calaba Town and Waterloo) experienced chronic undervoltage conditions (e.g. 190V - 205V on average) whereas MSMEs in the west (e.g. Wellington, Lumley and Murray Town) benefited from stable voltage supply levels close to the nominal 230V standard. These findings indicate that while some areas maintain acceptable voltage quality, others suffer from chronic undervoltage that can render equipment inoperable or excessive overvoltage that damages equipment, poses safety risks and ultimately leads to financial losses for the MSME.
Interestingly, while businesses in the Western area receive on average 230V, they also experience the worst overvoltage duration per day and experienced voltage surges that damaged appliances and equipment. Replacement or repair costs for affected appliances were reported to exceed several hundred Leones (SLE) per incident, representing a financial burden for MSME operating with limited liquidity.

Overall, we find that the spatial and operational PQR inequities experienced by MSMEs not only reinforce existing patterns of urban economic inequalities but have significant implications for grid-wide performance and economic resilience. Addressing these challenges requires: (i) targeted and spatially responsive grid planning and network efficiency investments and (ii) a revision of existing institutional logics around grid operations and regulations in a way that centers MSME interests, productivity, and economic performance to ensure that both EDSA and MSMEs profit from efficiency improvements.