Better data for better power grids
Across the globe, nearly 800 million people cannot access electricity, while billions live with unreliable and intermittent sources of power.
We’ve built a technology platform that provides utilities, regulators, governments, and funders access to accurate and cost-effective data about power grids, enabling them to better detect issues and prioritize investments.
Turn-key remote monitoring, made possible
With our GridWatch technology, you’ll have access to power quality and reliability data within weeks. More information about the key performance indicators (KPIs) that we use can be found in our brief below.
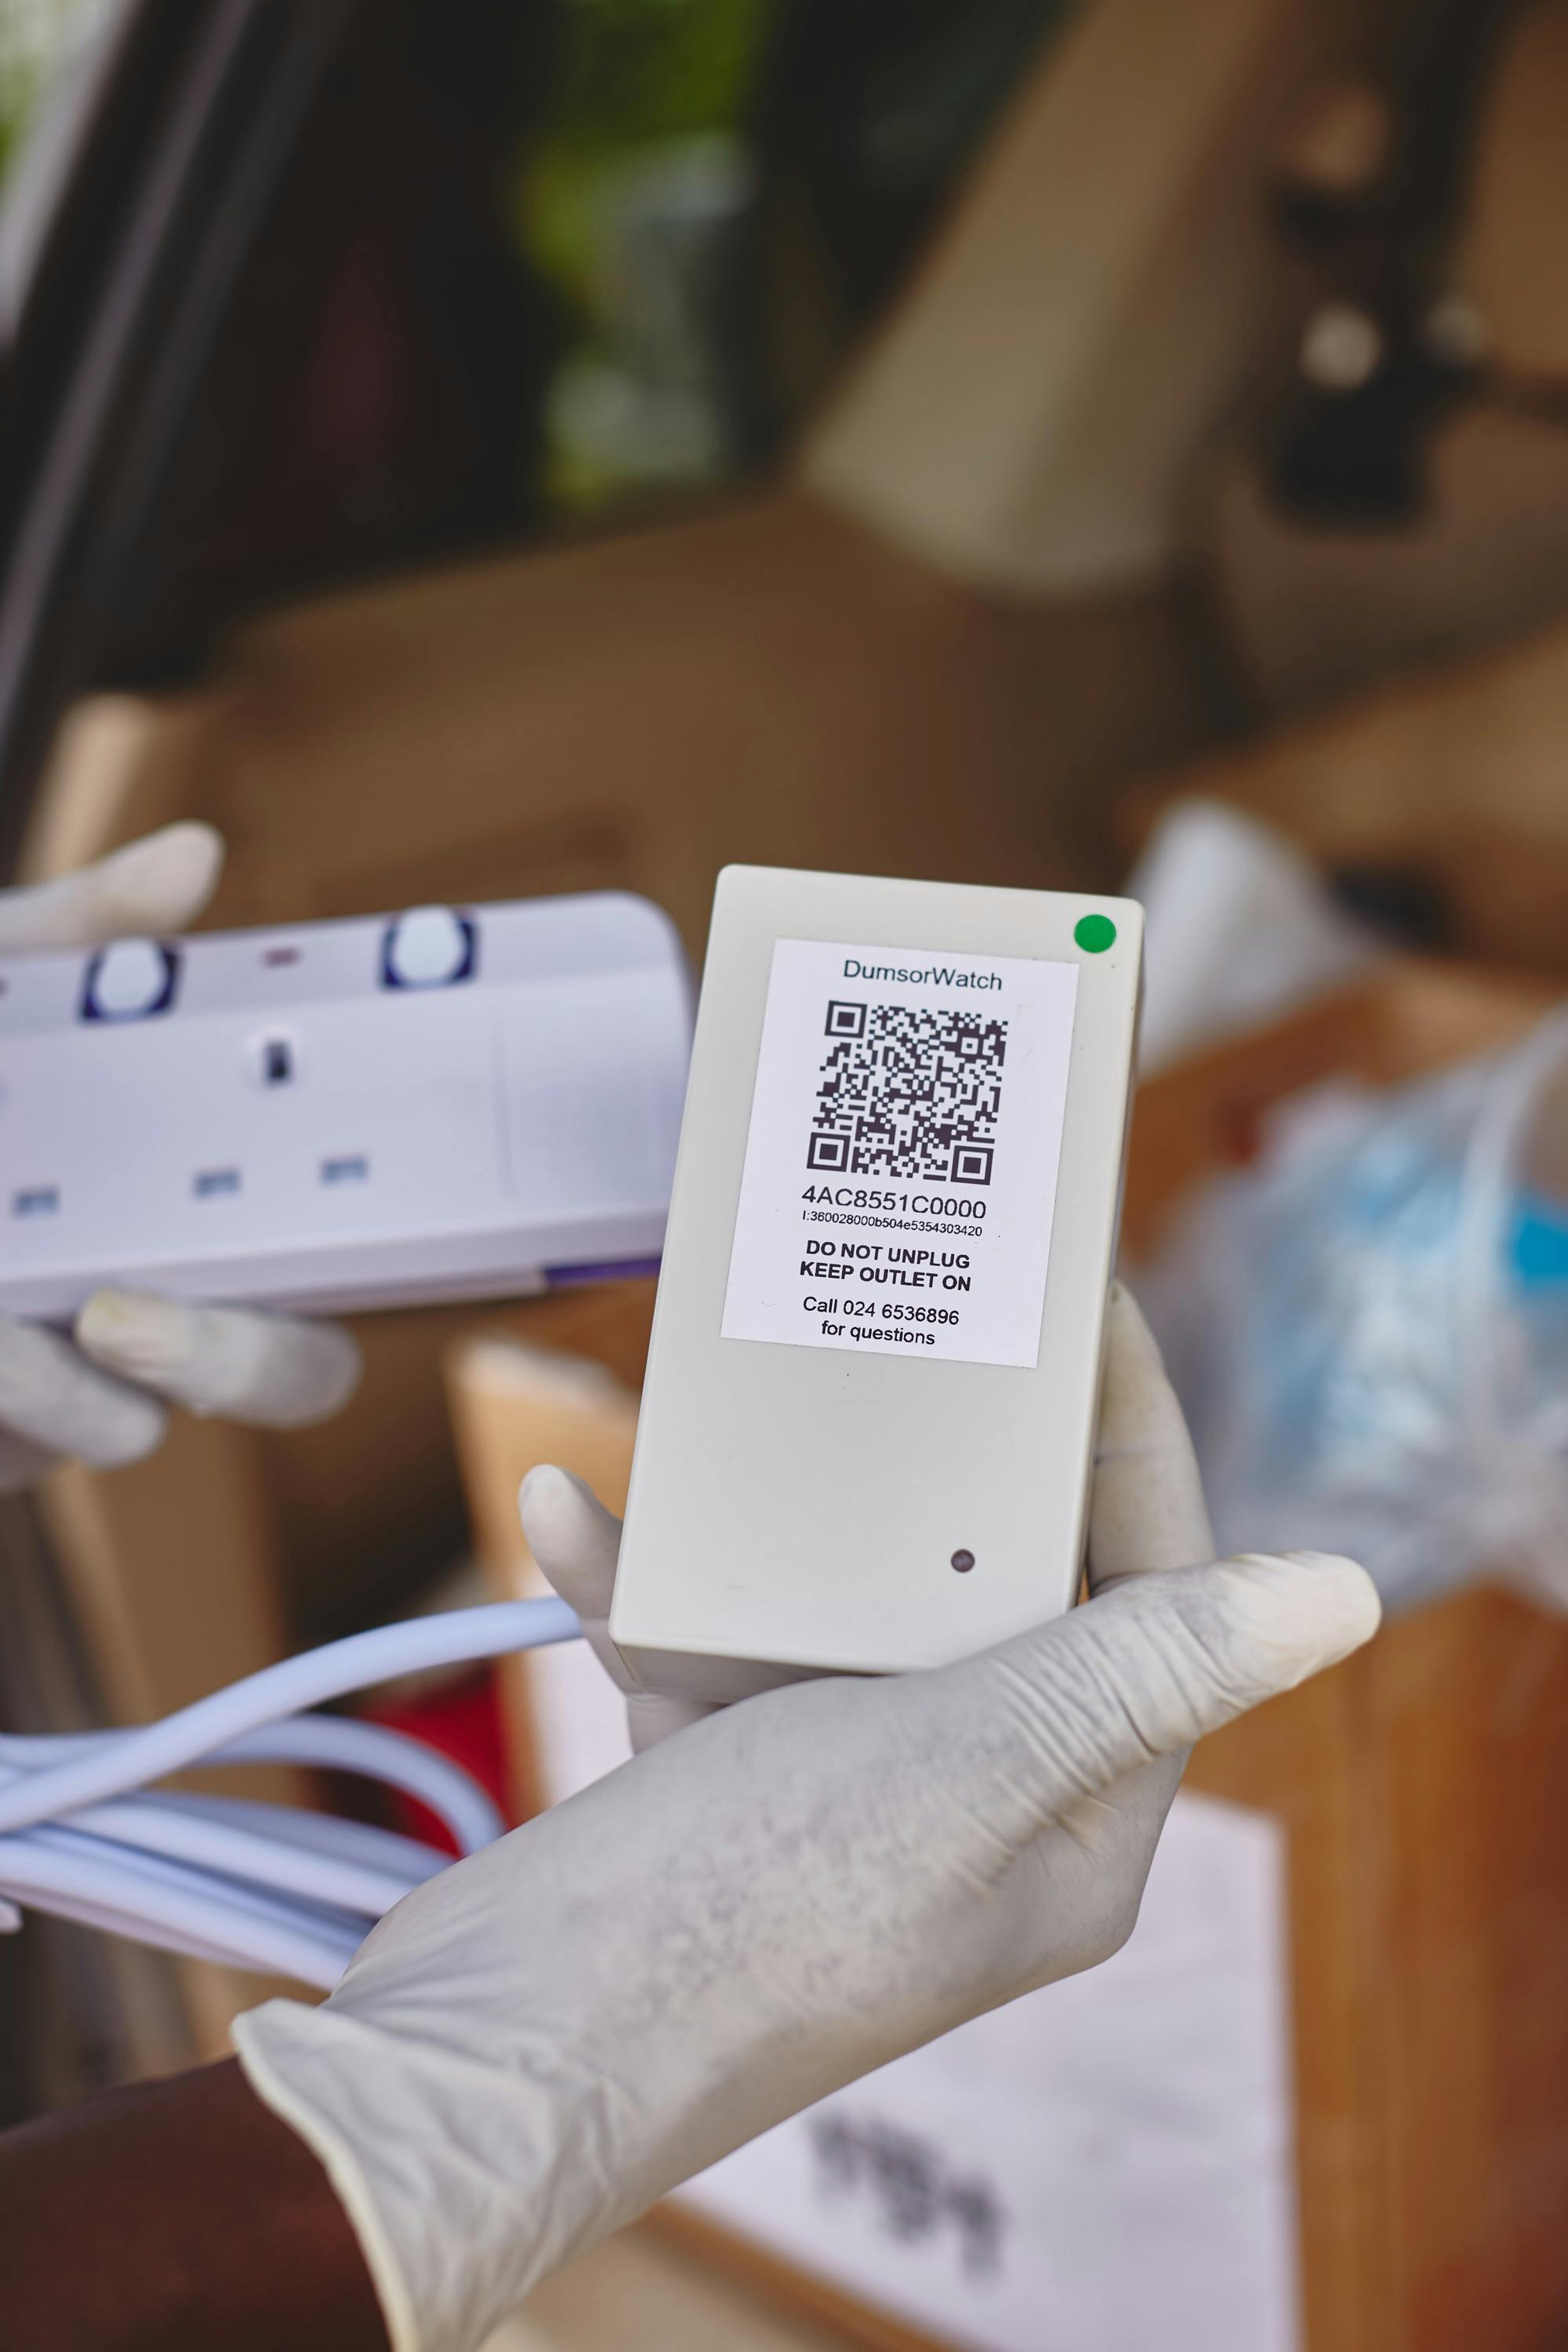
Sensor installation and data collection
Our robust sensors are plugged into outlets in residential homes or critical public infrastructure, such as healthcare facilities and collect data about electricity reliability and power quality.
Deployment monitoring
Our team of trained field staff are automatically notified when sensors go down and follow our robust deployment methodology to ensure GridWatch continues to collect high quality data.
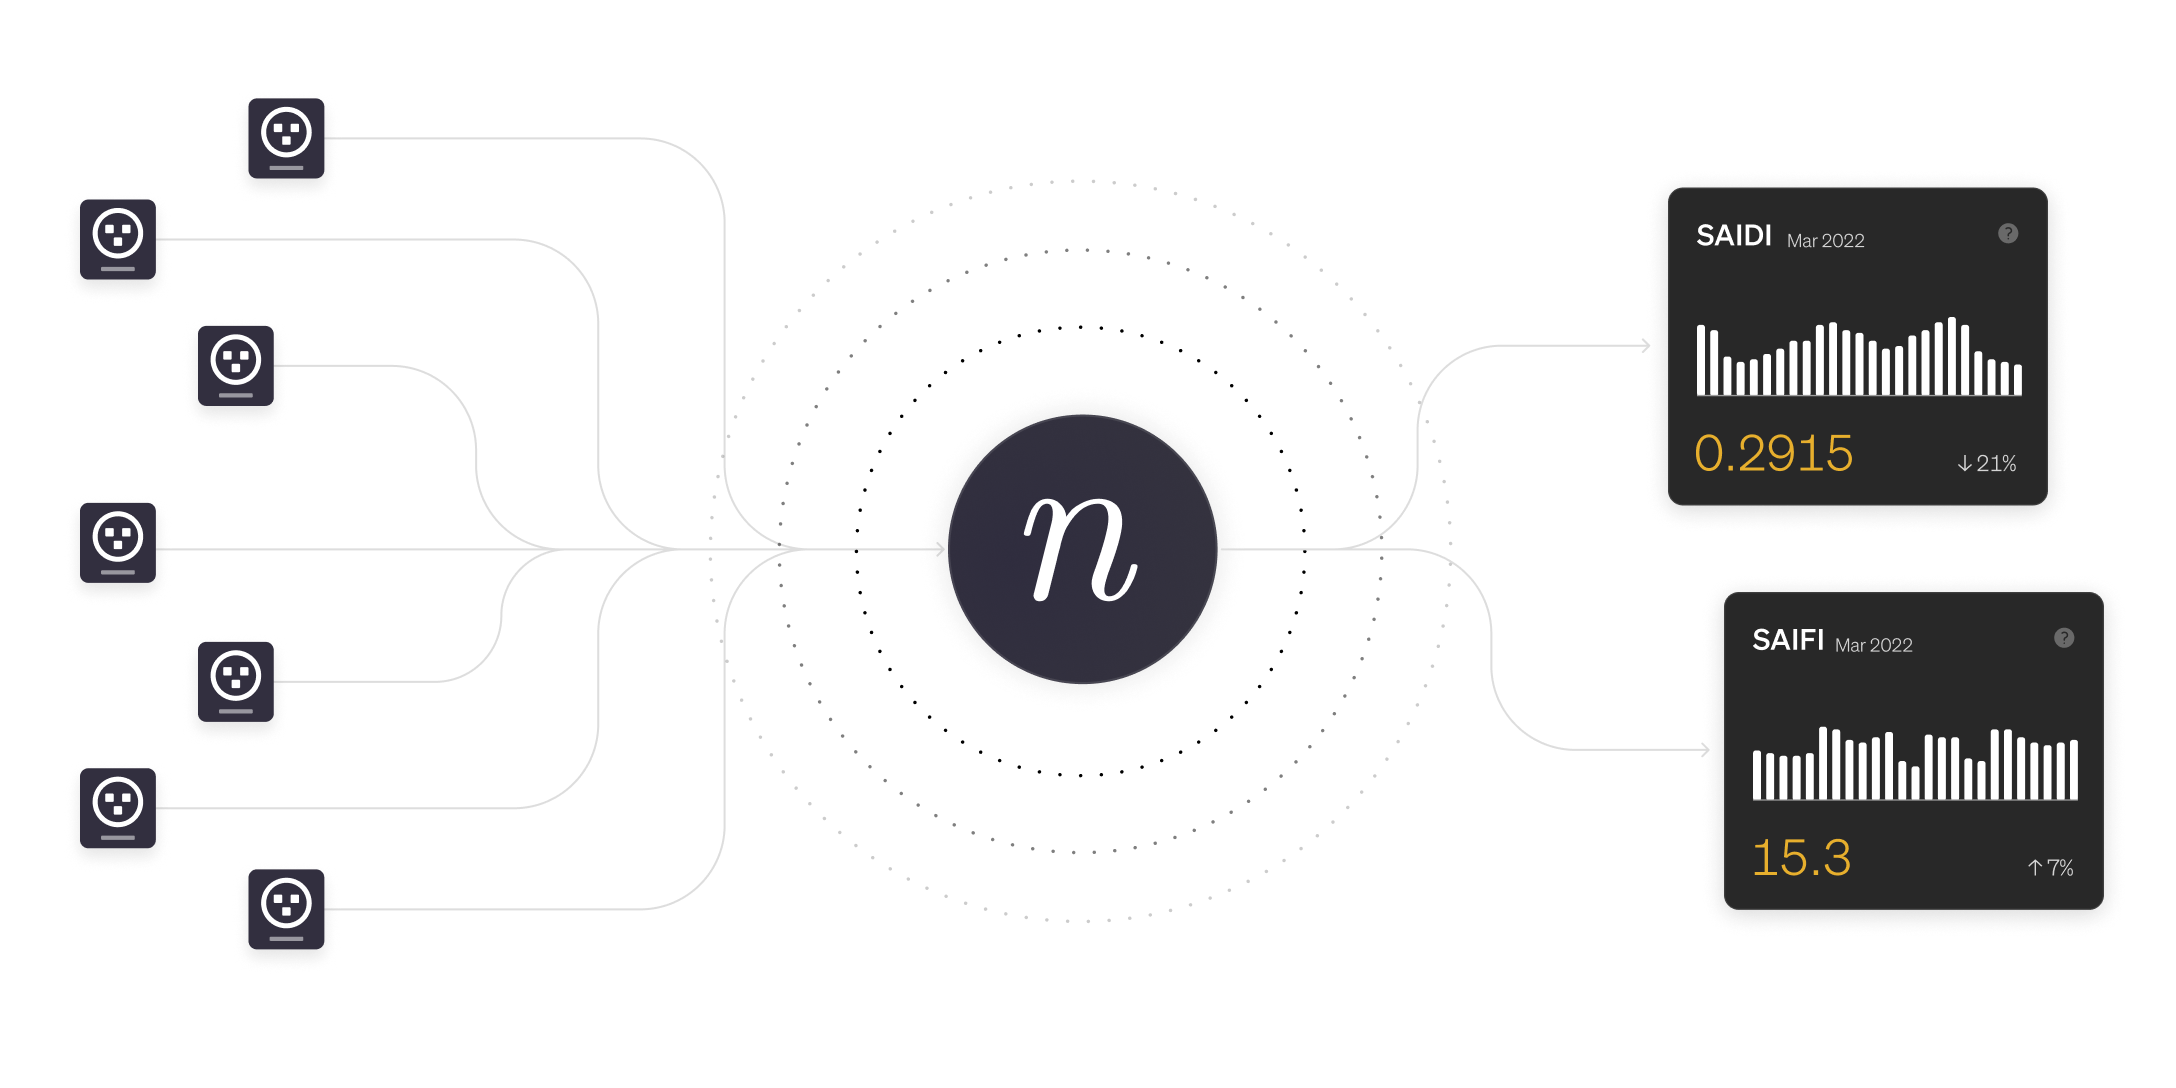
Generating high-level KPIs
Sensor data is aggregated and filtered into grid-wide metrics like SAIDI and SAIFI and key power-quality insights about specific infrastructure, all viewable on live-dashboards.
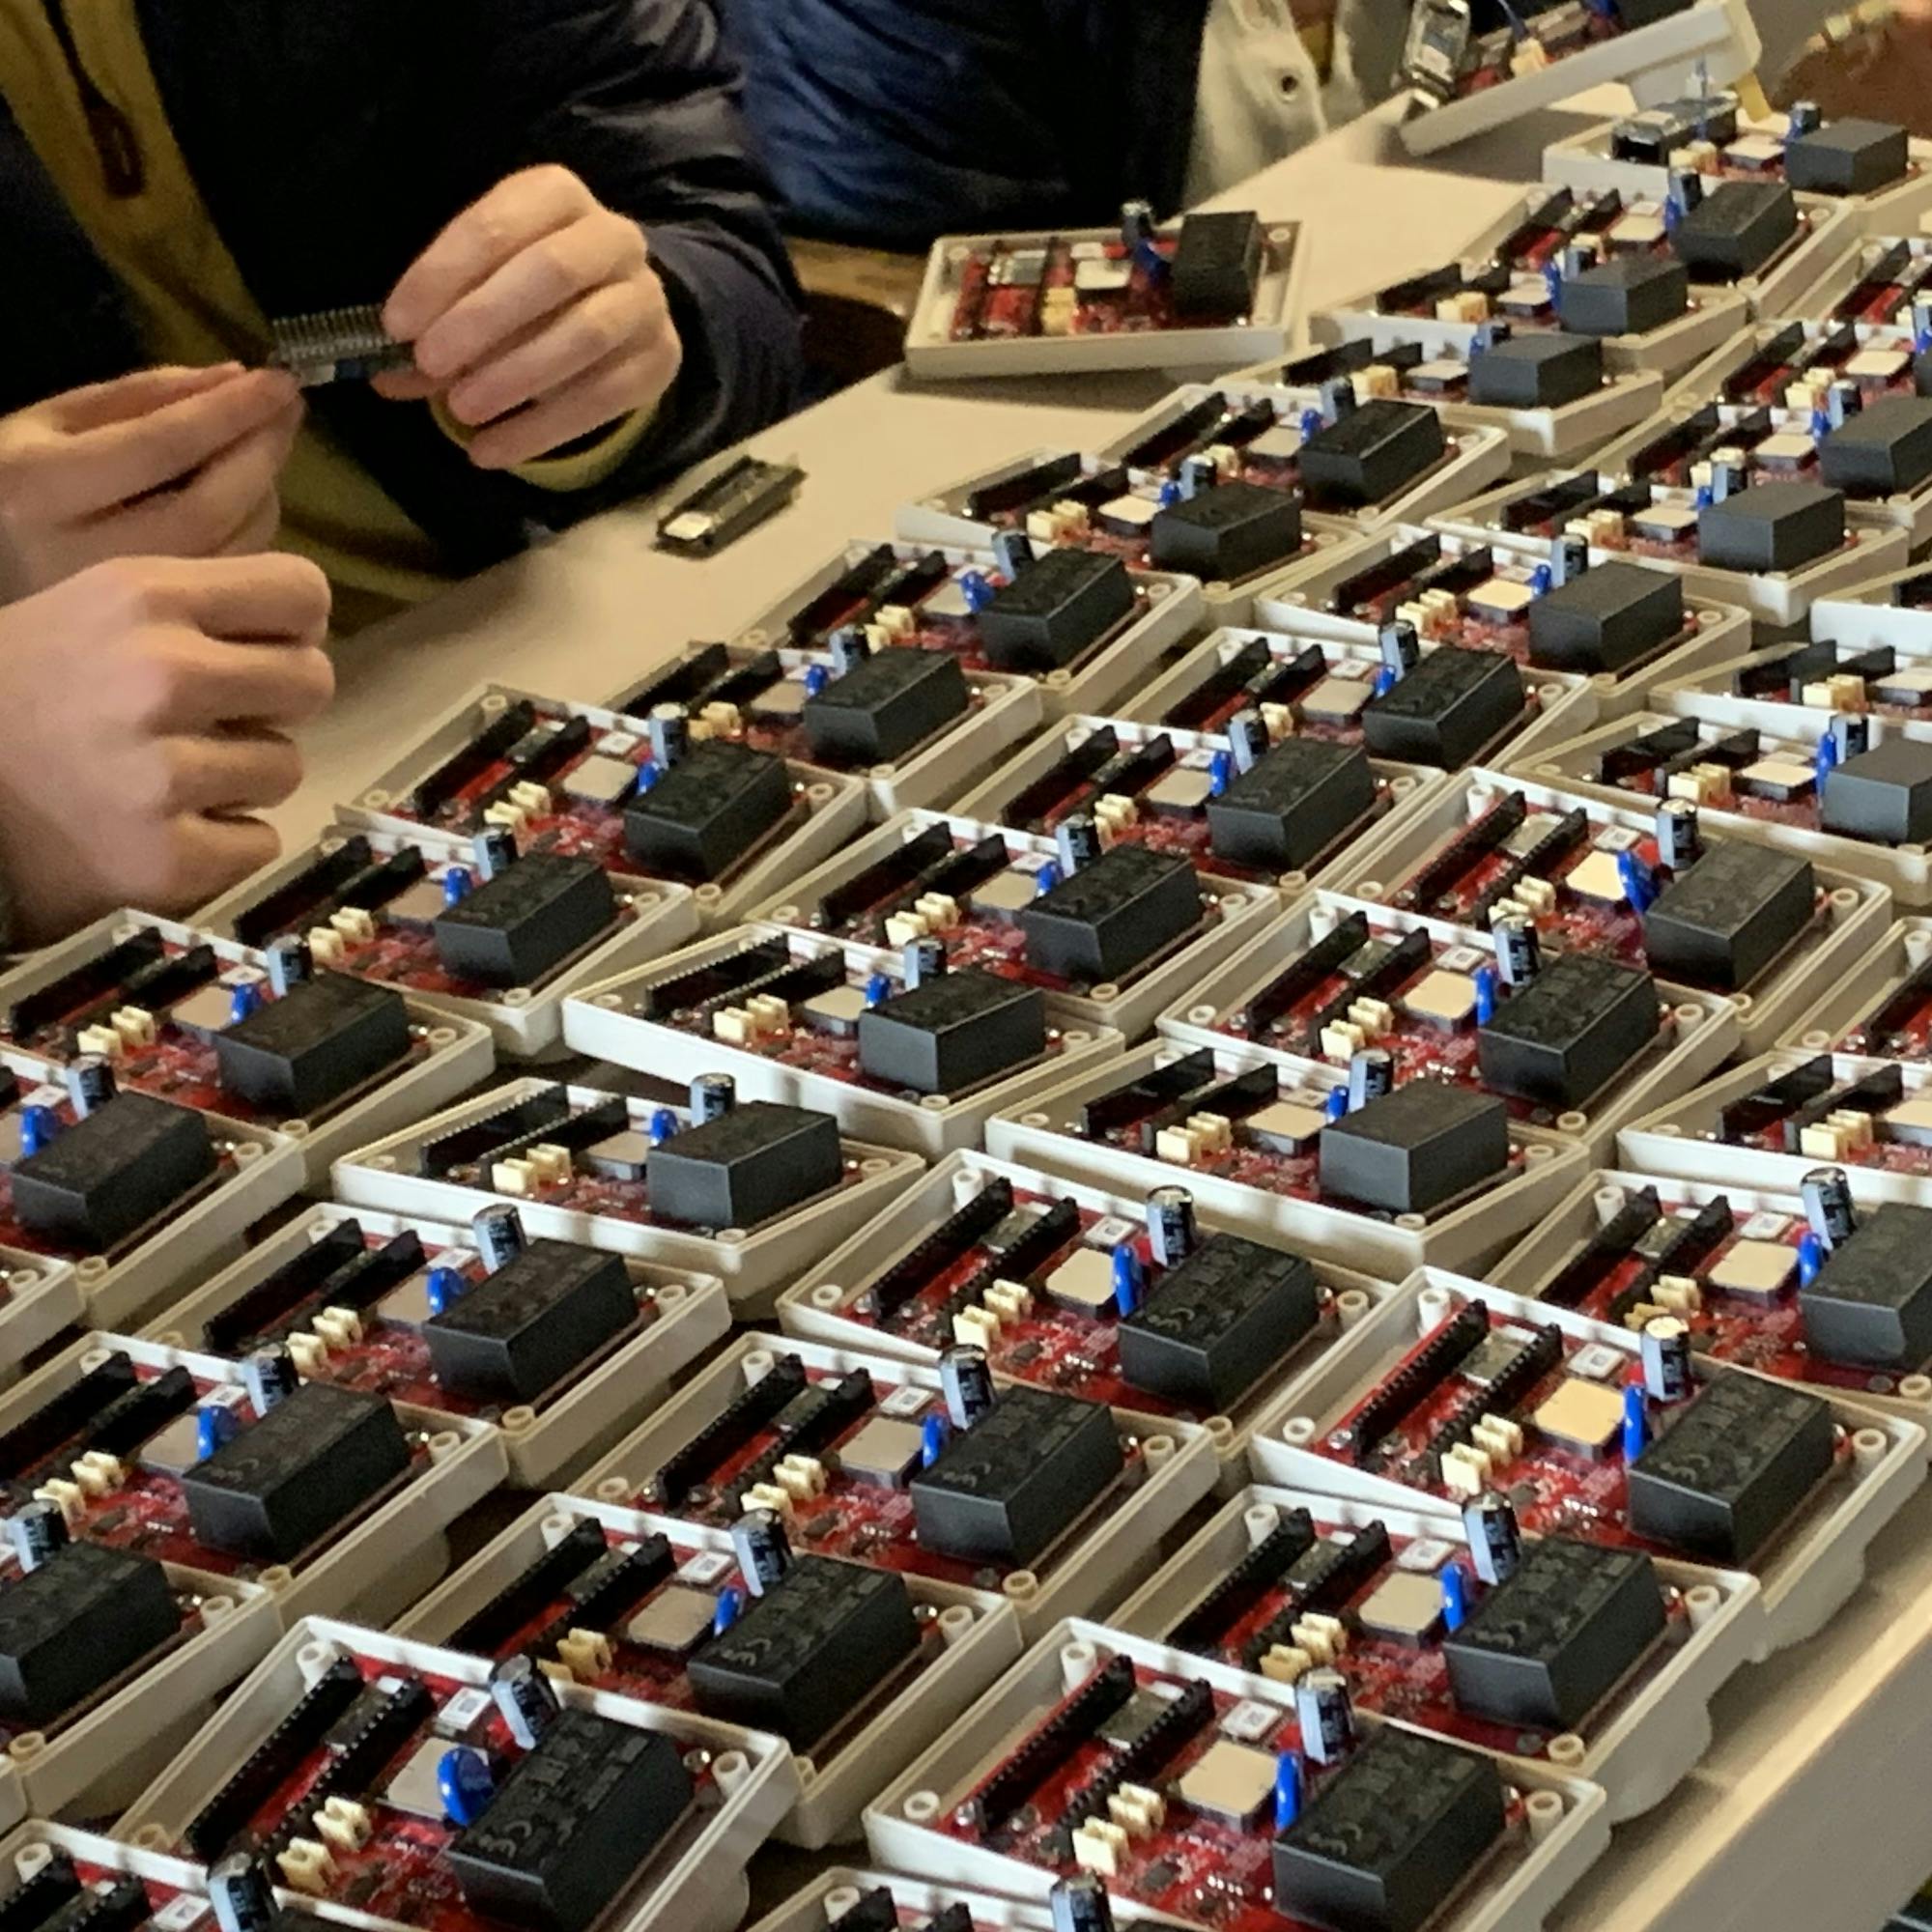
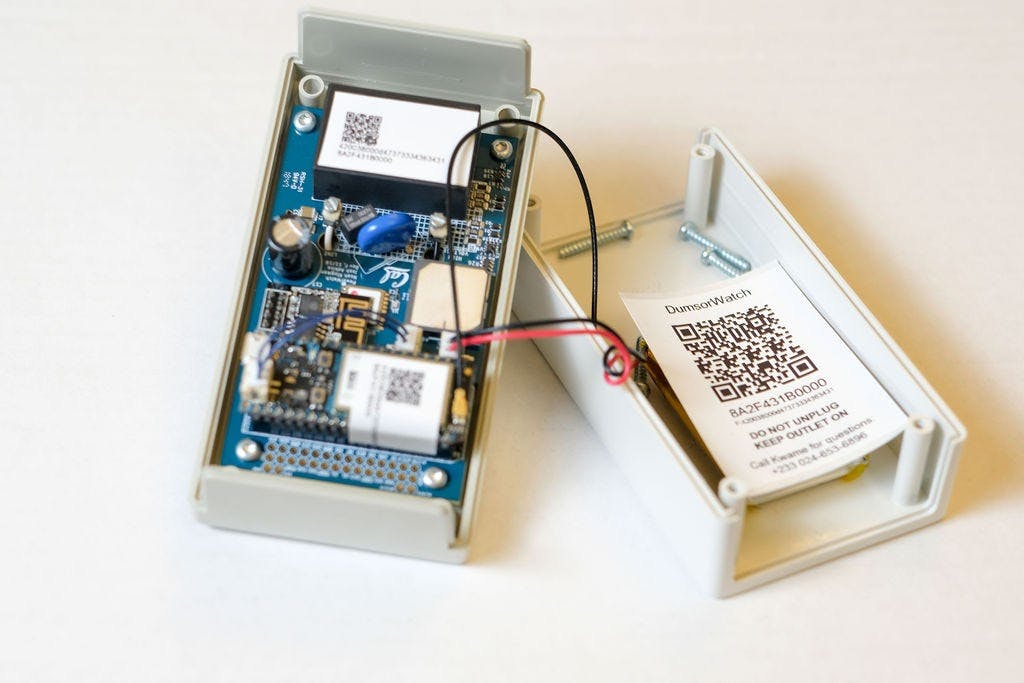
Robust sensors gather power quality and reliability data
Sensors plug into a standard outlet and collect data about power reliability and quality. They report that data over the cellular network using a universal SIM, store the data locally in times of poor network quality, and include a battery so they are ready to collect data even after long outages.
Insight-forward analytics pipeline
Our standard data analysis tools provide grid-wide performance metrics about outages and voltage and display those in live, interactive dashboards.
How it all fits together
GridWatch gives you all the pieces you need to monitor grids.
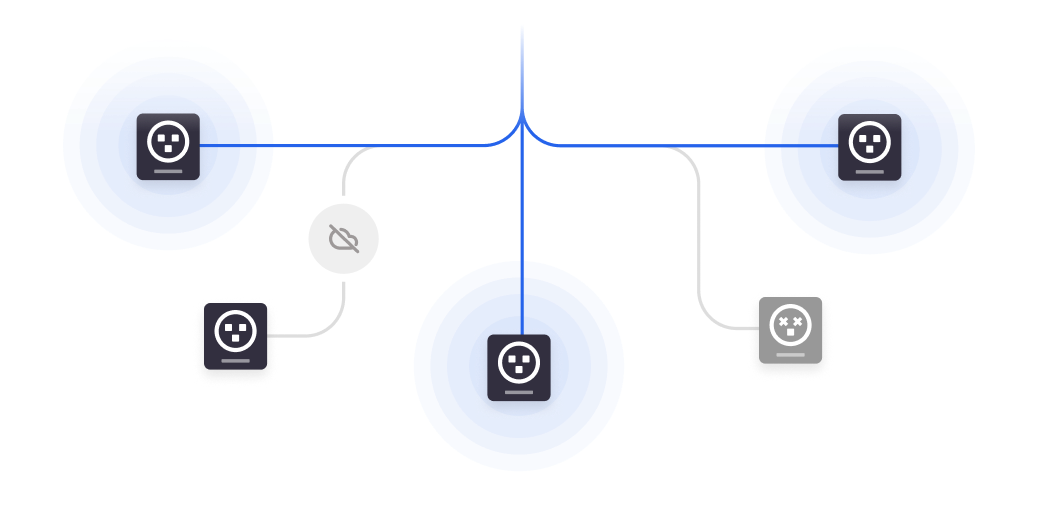
Reliable, continuous data
Our sensors have been designed to work in any environment, handling extended outages or real-world complexities like accidental unplugging or periods of low-voltage.
Real-time feedback
Utility providers can get data about the performance of specific infrastructure to better target maintenance and improvements.
Works in any context
Our platform has been tested on large national grids, in healthcare facilities, and on mini- and micro-grids of renewable energy installations.
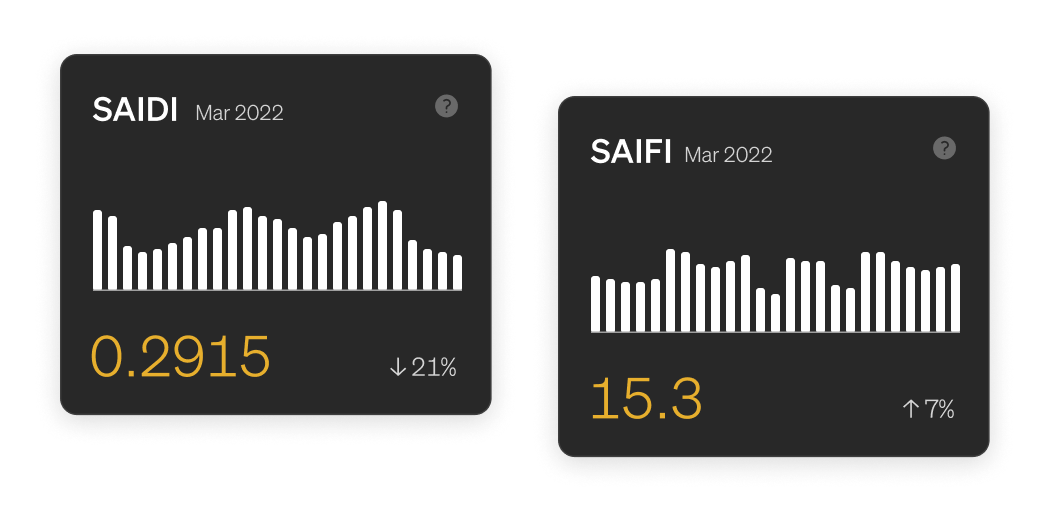
KPI reporting
Summarize historical data into continuous reporting on SAIFI, SAIDI and others to quickly evaluate the overall health of the grid.
Voltage quality
See average voltage, spikes and sags (brownouts) by district, by neighborhood, and by time period.
Low-touch install and operation
Our sensors are designed to be easy to install and minimize the need for replacements, so initial deployments are easy, and ongoing care is too.

Designed for Sub-Saharan Africa
Unlike generic power measurement platforms, nLine’s methodology is specifically designed to work in Sub-Saharan Africa and handle the operational challenges unique to it.
No modifying existing infrastructure
nLine's sensors can be deployed without any change to existing infrastructure, allowing for independent monitoring of utility companies.
See us in action
We’ve deployed over 2,500 sensors across 9 different countries. Read our case studies to see the impact it’s had for others.
Get in touch
We’re open to new partnerships, or sharing more with people interested in our work.