
Grid monitoring
where it’s most needed
We partner with government agencies, funders, power providers, and researchers to provide accurate, timely data about energy systems. Our custom sensors, analytics, and expertise help customers better focus their investments into grid infrastructure.
Our process
What does working with us look like?
We work with partners on incremental projects, or large-scale deployments. Projects usually follow four steps.
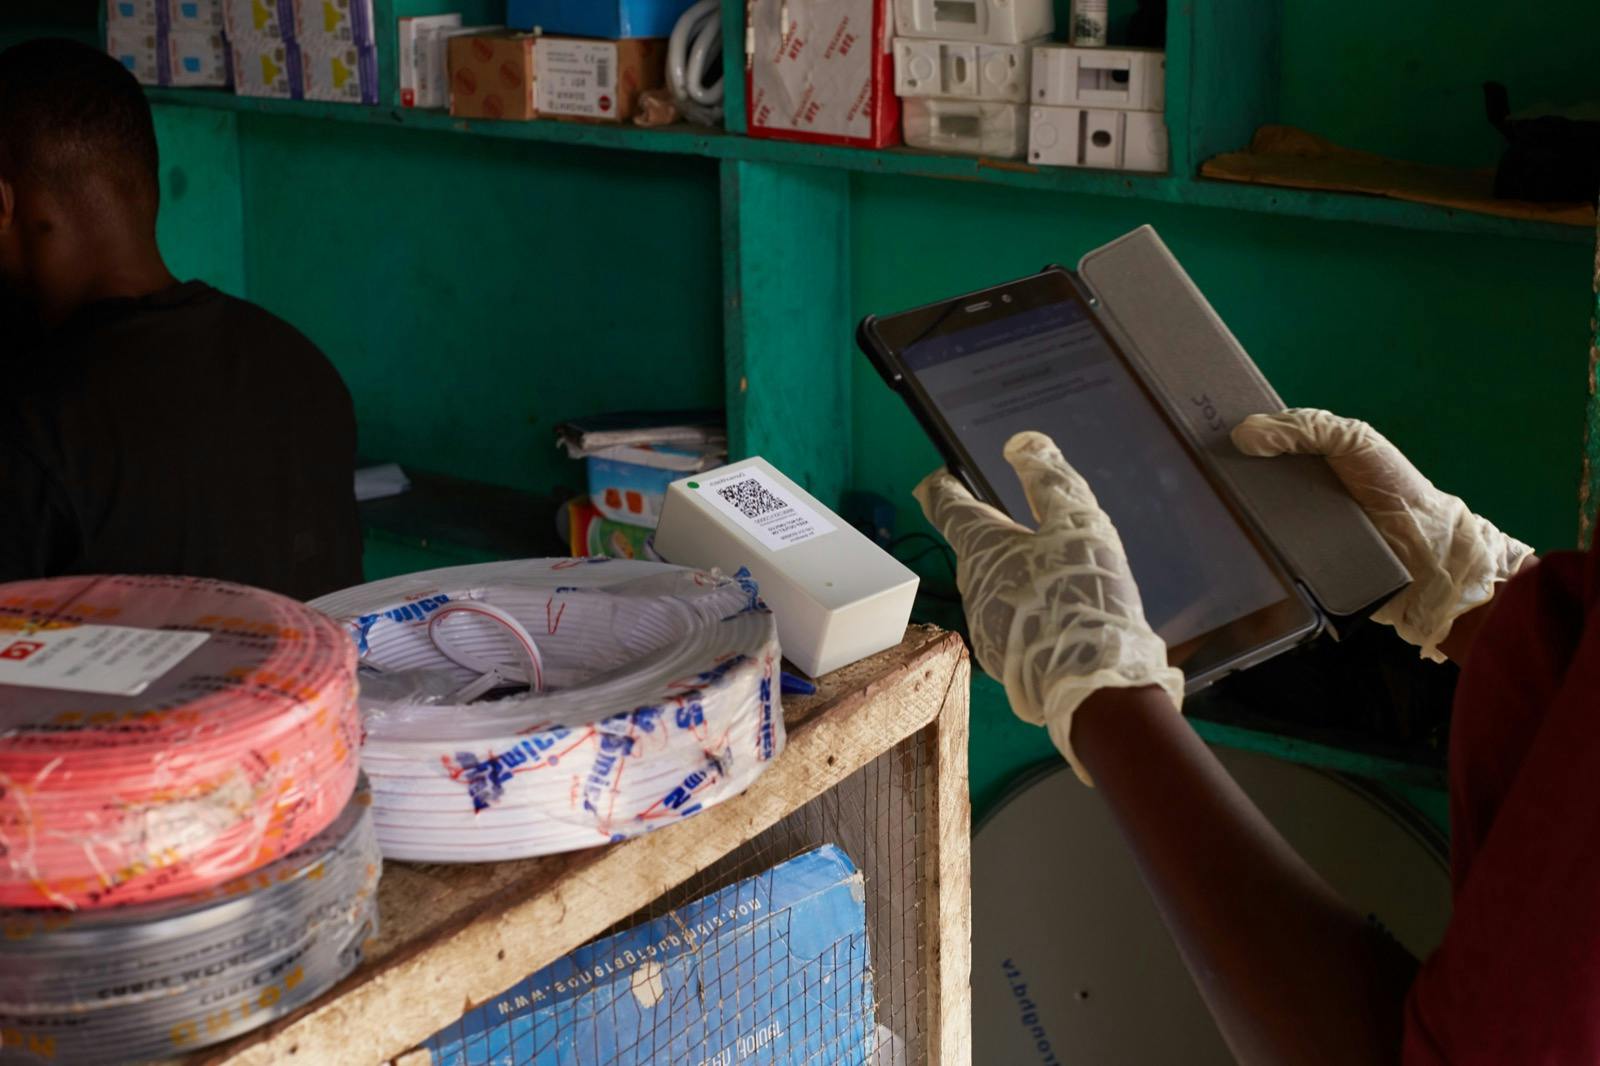
We build local teams to deploy our custom sensors in residents’ homes, and in key locations for accurate data collection.

Our work
Sensor deployment projects
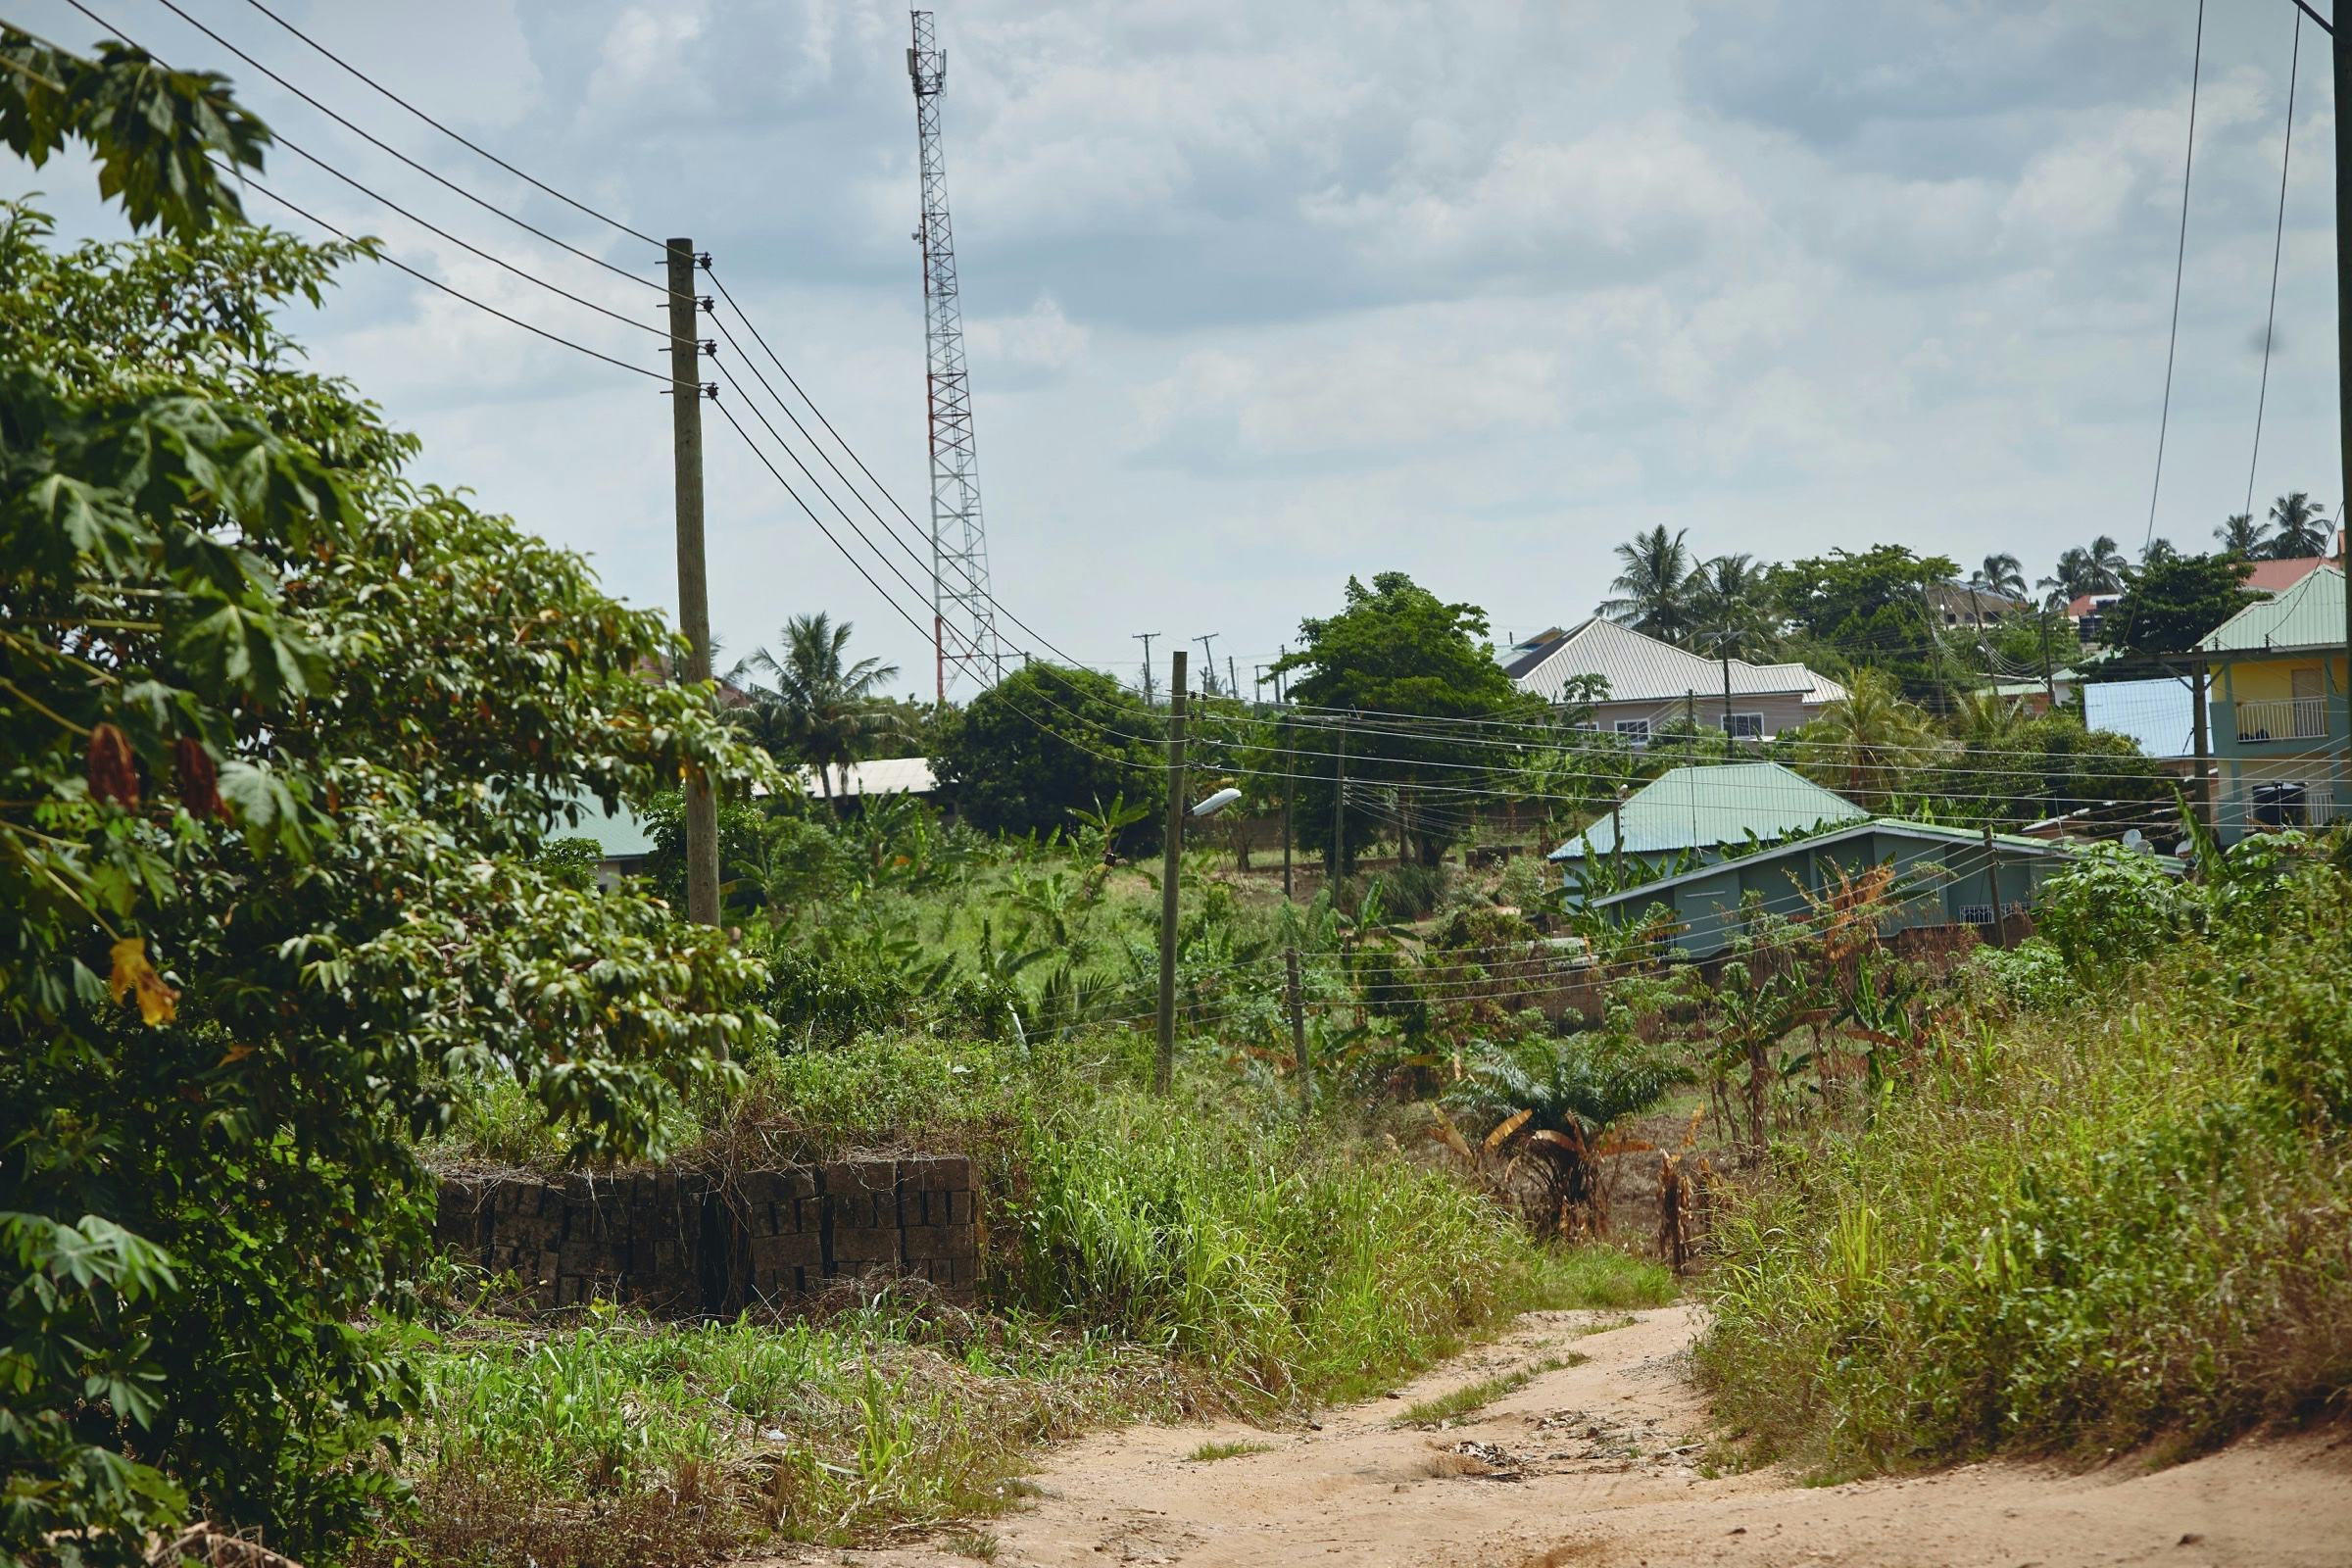
For the past 5 years we’ve been refining our methodology and deploying it to real effect in diverse contexts in Sub-Saharan Africa.


Why it matters
Better data means better outcomes for everyone
Clearer operational visibility
With our sensors deployed, utility providers can better understand where the grid is weakest and respond accordingly.
Improved long-term planning
Government agencies, funders, power providers, and researchers can use our data to better prioritize investments and evaluate real program outcomes.
Better service for citizens
At the end of the day, people get better service when the infrastructure they rely on is monitored.
More about our projects
We regularly publish behind-the-scenes details of our work on our blog.
Get in touch
We’re open to new partnerships, or sharing more with people interested in our work.